After months of building, validating, and pressure-testing our tariff intelligence engine, Gateway is officially launching the U.S. Tariff Exposure Index — a new public benchmark designed to answer one simple question:
How exposed is each sourcing country to U.S. import tariffs right now?
What is the U.S. Tariff Exposure Index?
Think of it as an S&P 500–style index for tariffs.
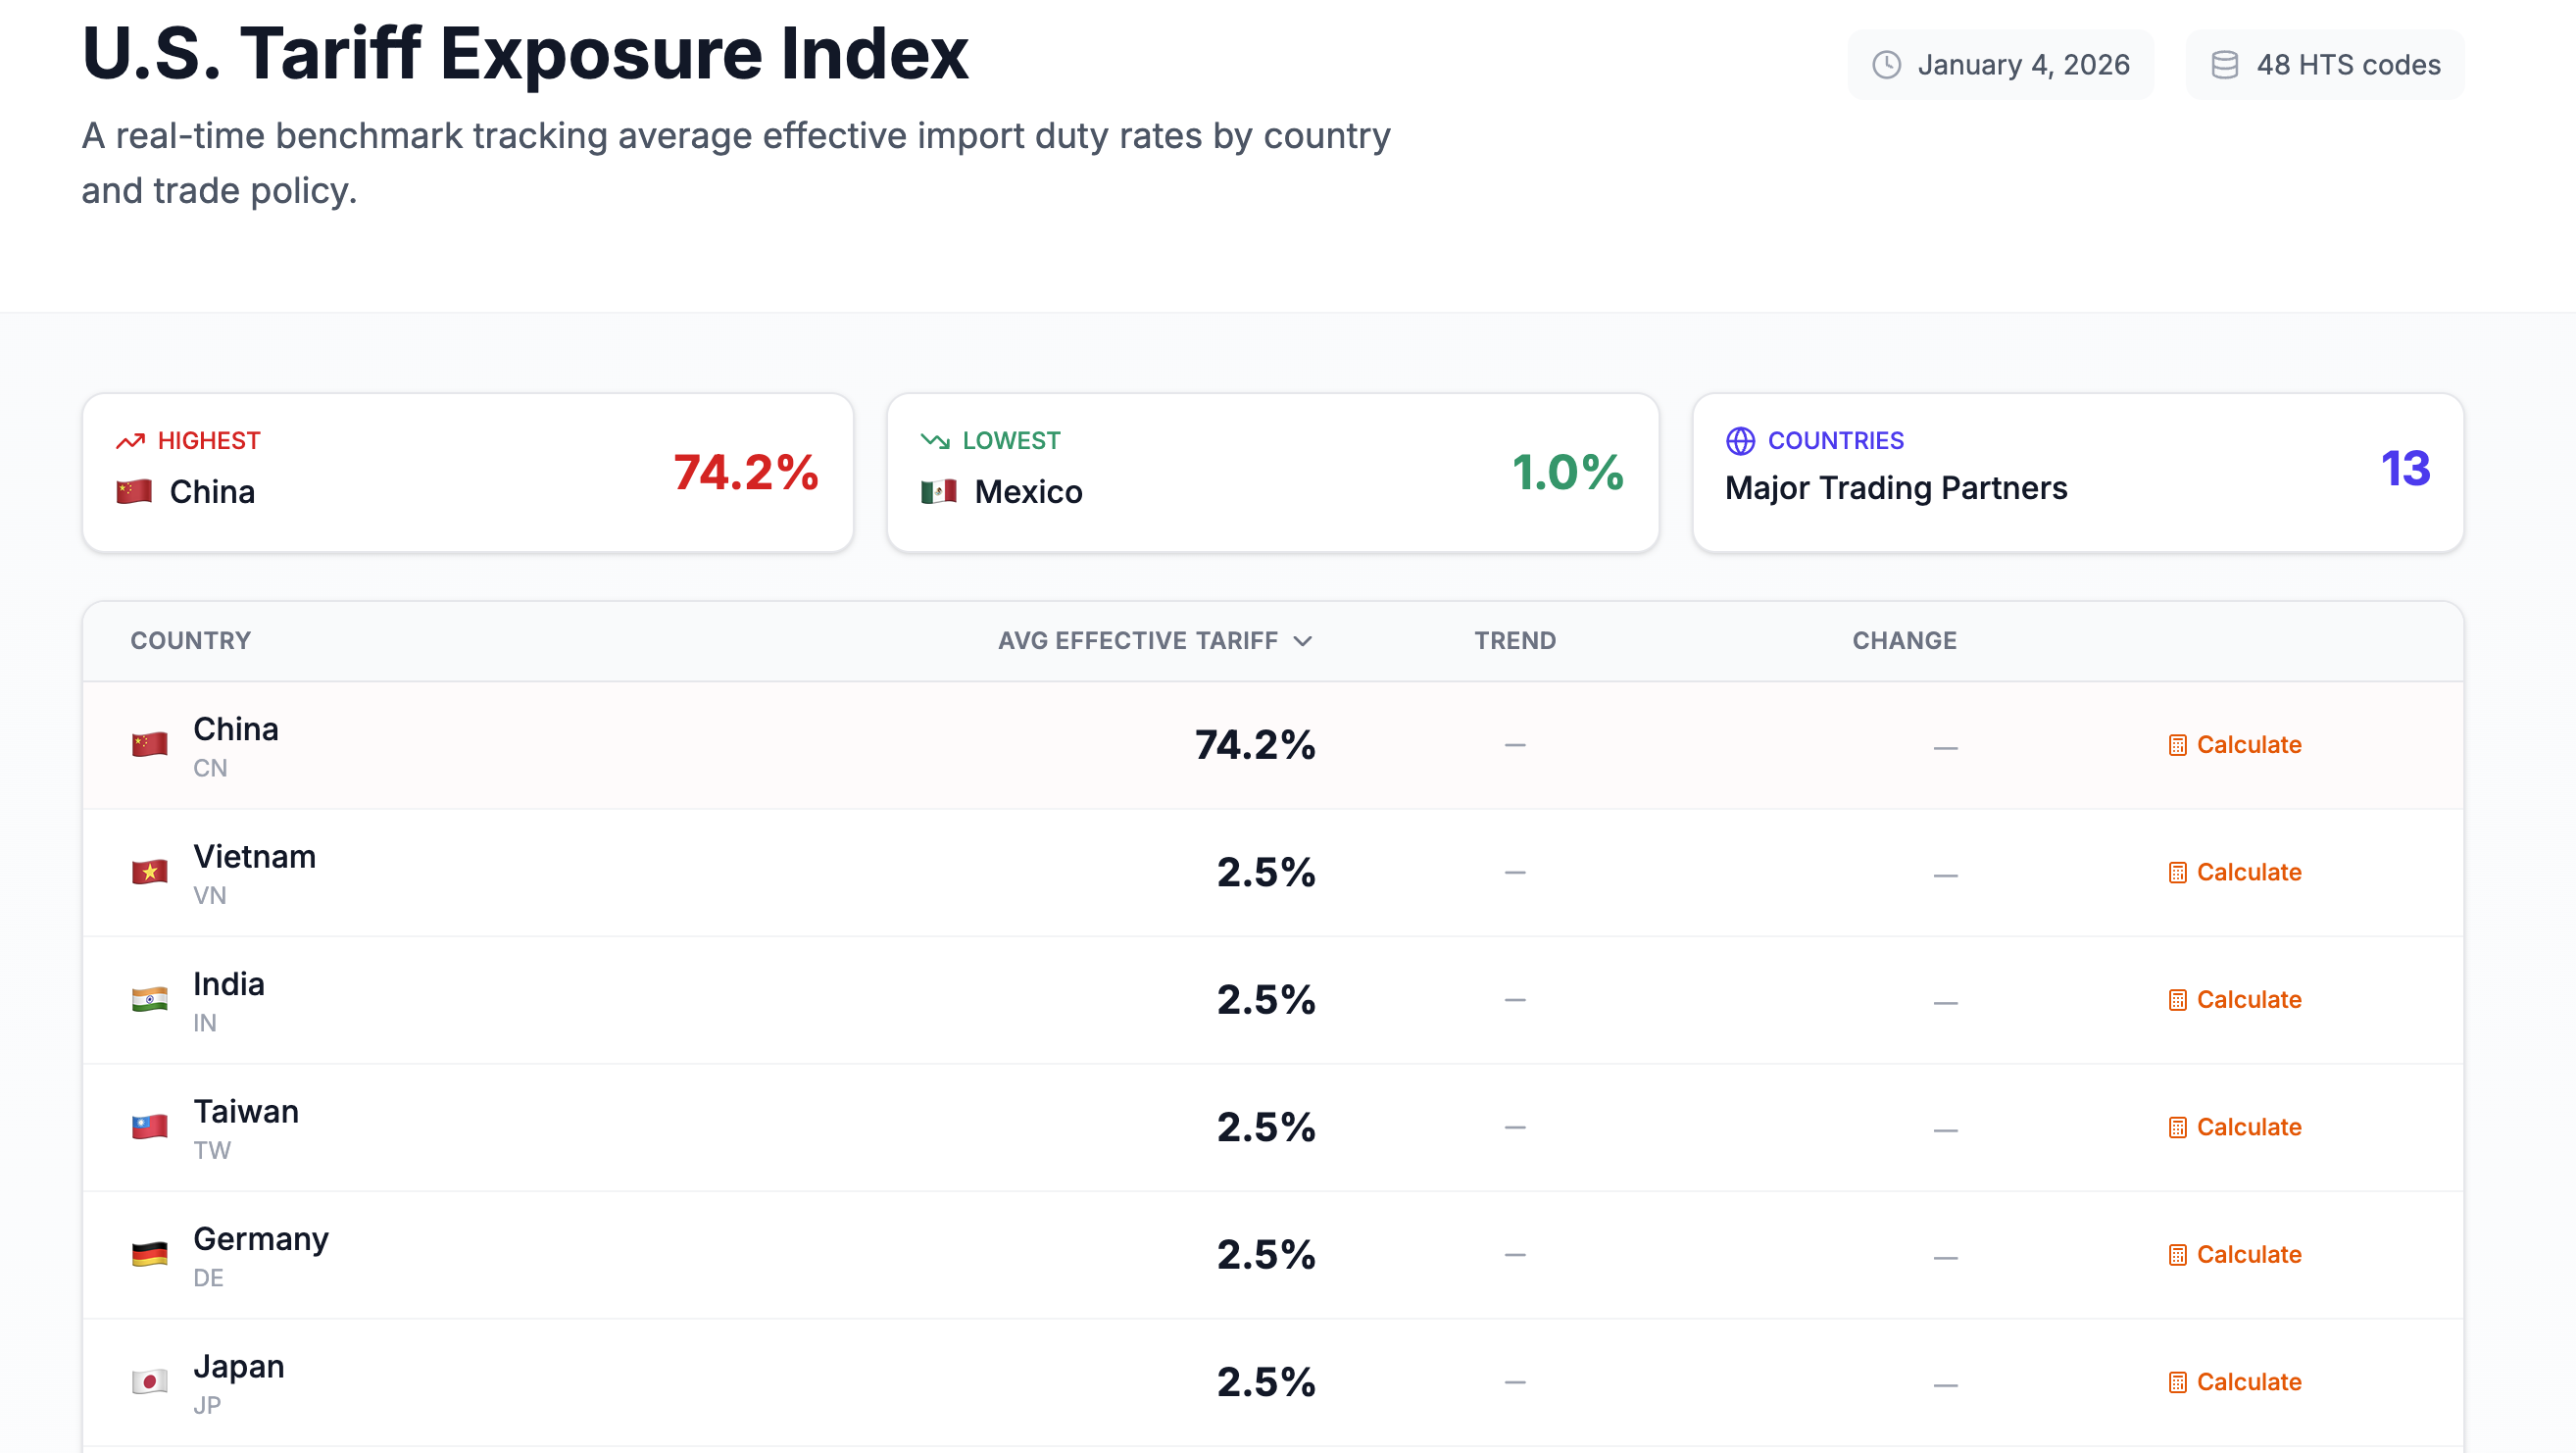
The U.S. Tariff Exposure Index tracks the average effective U.S. import duty rate by country, calculated across a representative basket of commonly imported goods. Instead of looking at one HTS code at a time, the index gives you a high-level, apples-to-apples view of tariff exposure across major trading partners.
This allows importers, operators, and analysts to instantly see:
Which countries carry the highest tariff risk
Which sourcing locations are structurally lower-cost
How U.S. trade policy is shifting over time
How the Index Works
The index is computed using a basket of 48 widely imported HTS codes, covering categories such as:
Electronics
Furniture
Machinery
Apparel
Auto parts
Household goods
For each country, Gateway calculates the effective tariff rate by applying all relevant U.S. trade measures, including:
MFN base duties (HTS)
Section 301 tariffs (China)
Section 232 steel and aluminum tariffs
IEEPA tariffs
Country-specific exemptions where applicable
Each country’s index value represents the simple average tariff exposure across the basket, updated automatically.
What Makes This Different
Most tools show tariffs one product at a time. The U.S. Tariff Exposure Index shows systemic exposure.
That means:
You can compare countries without choosing a specific product
You can spot structural advantages (or risks) immediately
You can track changes driven by policy updates, not anecdotes
For example:
China’s index reflects stacked Section 301 and IEEPA tariffs
Canada and Mexico appear lowest due to Section 232 exemptions
Countries without FTAs converge around similar MFN-driven averages
This is not guesswork — it’s computed directly from Gateway’s tariff database using the same logic that powers our duty calculator.
Update Schedule and Transparency
Updated daily at 6:00 AM UTC
Monthly snapshots saved on the 1st for trend analysis
Methodology and data sources are published directly on the index page
No external scraping — all calculations are derived from Gateway’s internal tariff intelligence tables
Built for Real Decisions
The U.S. Tariff Exposure Index is designed for:
Importers evaluating sourcing strategies
Operators tracking policy risk
Analysts monitoring trade policy impact
Anyone tired of guessing how tariffs actually affect countries at scale
You can click any country in the index to jump directly into the tariff calculator and run product-level analysis.
This Is Just the Beginning
The index lays the foundation for deeper insights, including:
Historical trend charts
Policy-driven change attribution
Country-to-country sourcing comparisons
Integration with landed cost and logistics intelligence
You asked for a clear, honest view of tariff exposure.
We built it.
The U.S. Tariff Exposure Index is live now at tariff.gatewaylines.com/tariff-index.